[pdf-embedder url=” https://mindfirewall.com/wp-content/uploads/2019/09/The_Strategy_2019-09-19.pdf”]
VIDEO #1
2018-10-08
CLDC
6.25% GAIN
SPREADSHEET
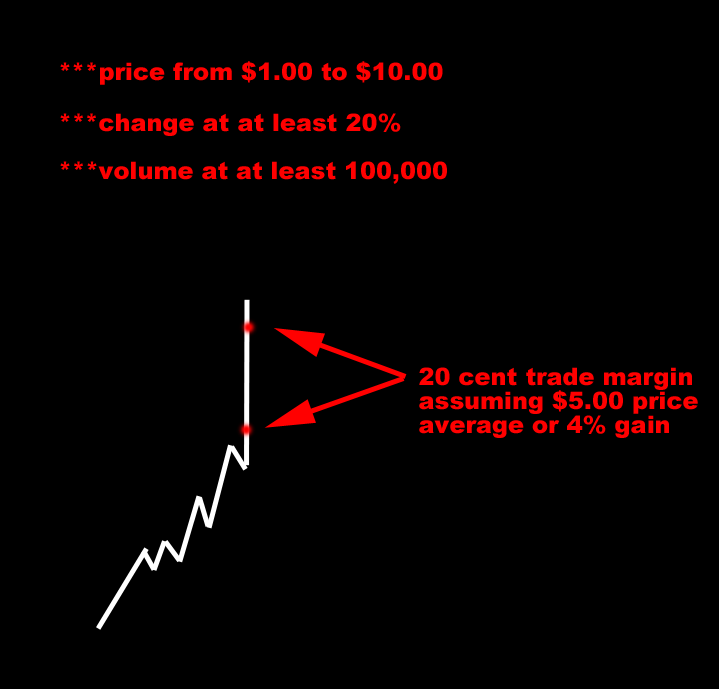
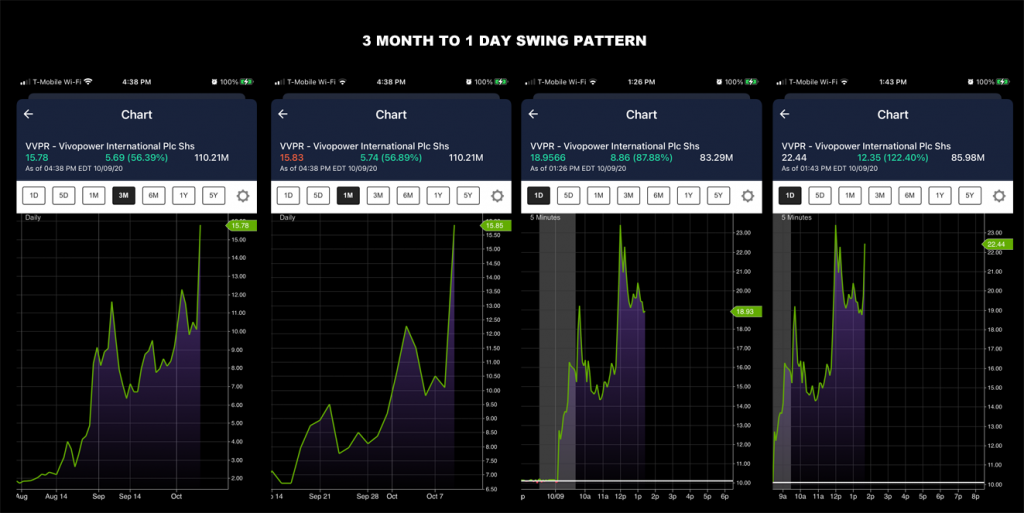
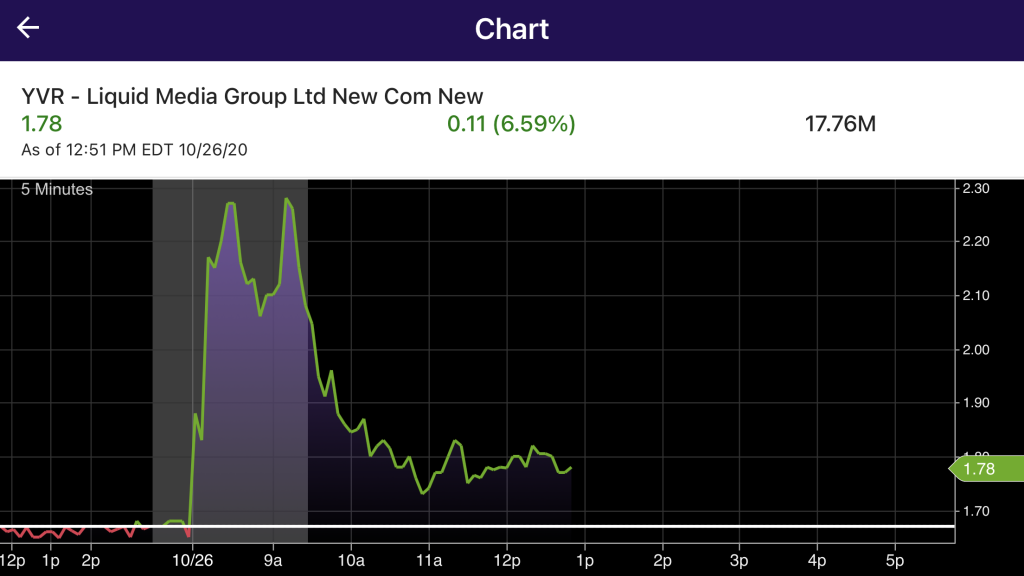
NOTE: Example of price volatility/fluctuation.
VIDEO #2
2018-09-21
IGC
6.83% GAIN
SPREADSHEET
NOTE: Step-by-step audio instructions.
VIDEO #3
2018-09-24
XBIO
3.06% GAIN
SPREADSHEET
NOTE: Step-by-step audio instructions